Understanding TEEP...
TEEP stands for Total Effective Equipment Productivity (Performance). TEEP is a performance metric that shows the total performance of equipment based on the amount of time the equipment was present. Typically the equipment is onsite and thus TEEP is metric that shows how well equipment is utilized.
TEEP = Planned Equipment Downtime% X Availability% X Performance% X Quality%
TEEP is a valuable metric to understand performance but it is even more valuable when you look at OEE and the other three metrics that make up OEE.
OEE = Availability % x Performance% x Quality%
Availability:
Availability accounts for downtime losses as a function of the total planned operating time.
Availability = Operating Time / Planned Operating Time (Operators Present)
Performance:
Performance captures speed and micro-stop losses.
Performance = Actual Rate / Theoretical or Ideal Rate
Quality:
Quality quantifies the losses from quality rejects.
Quality = Good Product / Total Product
Other Performance Metrics:
A good Real-Time Performance Management Solution will provide a user with more that just TEEP, OEE, Availability, Performance and Quality reporting and dashboards.
Also look at these handy manufacturing metrics:
-
Adjusted OEE
-
Cycle-time
-
Rate
-
Actual time for Planned downtime events like cleaning, Changeover, PMs, etc.
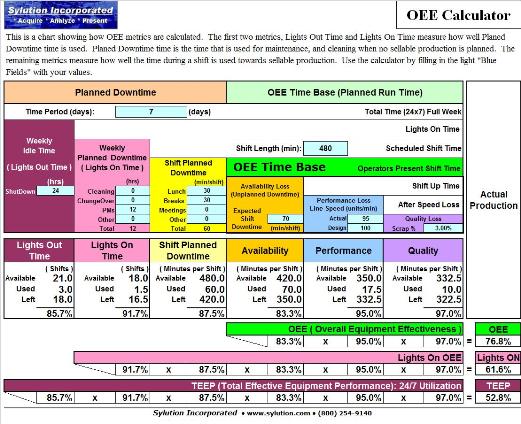
The picture below shows a manufacturing performance chart by Sylution Incorporated. The downloadable Excel version allows you to play around with the numbers to see how improvements to net operating time and performance increase the metrics and good units out the door.
Complete the download request below to receive an Excel copy of the Sylution OEE Calculator.
Click Here to download the Sylution OEE Calculator